How to Start with Decisions when Designing Analytics
By Tom Pallas and Shawn Reed
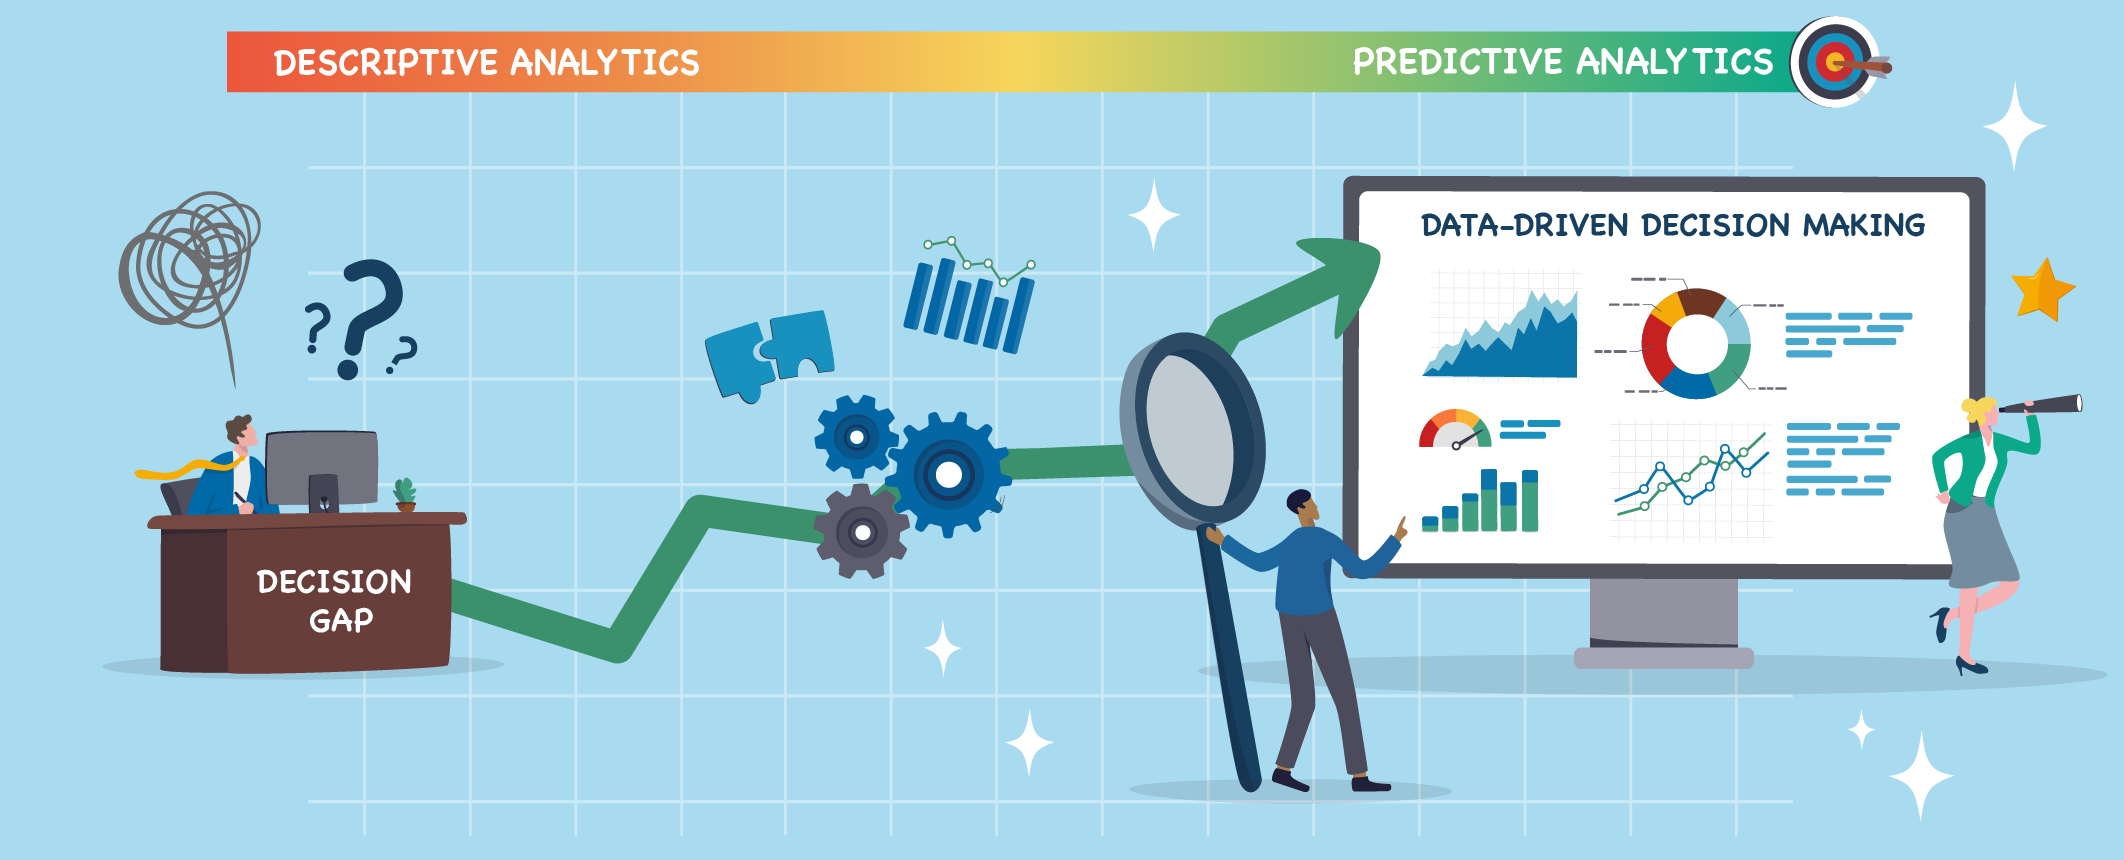
The Decision Gap
Leaders across public and private organizations at the beginning of the analytics maturity scale commonly use the phrase, “We can’t see ourselves.” It reflects an organization operating at the descriptive analytics stage (i.e., “What are we doing?”). To effectively operate in the modern digital world, organizations must rapidly progress to using predictive (i.e., “What will happen?”) and prescriptive (i.e., “What should we do?”) analytics. Mastering the first step lays the foundation for an organization’s data-driven decision-making journey.
Leaders understand their organizations have data but lack the capability to unlock its value for supporting their organization’s critical decision-making processes. The result is a significant opportunity cost, as leaders routinely receive static reports built on questionable analyses and lengthy review times. Where analytics do exist, they too often describe activity instead of providing the decision-support analysis leadership requires.
Leaders must first get the basics of data-driven decision-making right so they can leverage the power of data to make timely, informed decisions. In turn, this frees up staff from constantly describing problems and empowers them to help solve them instead.

Start with Decisions, Not Dashboards
One of the most common mistakes organizations make is dashboarding for dashboarding’s sake. Dashboards that organizations build for one-off needs are rarely (if ever) used and do not support leadership priorities.
Instead, leaders should start with decisions: What critical, recurring decisions must leadership make to meet their organization’s mission and vision?
These decisions typically fall within areas such as operations, resource management, personnel, risk, and other enterprise functions.
Leadership should first engage in a requirements-collection effort to identify their top 3-5 recurring enterprise decision processes. For each decision, they should consider:
What information do we review before making this decision?
What critical trends, thresholds, or other triggers signal the need for leadership action?
This ensures that resulting dashboards serve as decision aids, early warning systems, and tools that leadership can proactively leverage.
Over time, as leadership trust in the data grows, the organization can shift from dashboards as supplements to dashboards as enablers for decision-making. Without a clear requirement or decision tied to it, a dashboard is simply a static report.

Designing Analytics That Support Decisions
Once leadership identifies requirements, the organization can begin to design the dashboard in alignment with those needs. The goal of the design is to translate decisions into dashboards that leadership will use. Keeping this focus helps prevent scope creep and excess data.
When designing descriptive dashboards—the best entry-level, decision-making support for most organizations—the organization should follow some key tenets:
Develop one dashboard for one decision. Avoid over-complicated visualizations and align data to one decision.
Display trends over snapshots. Understand how the data changes over time.
Align the visual hierarchy to urgency. Lead with the most pressing problems.
Use common definitions. Leverage existing organizational definitions, taxonomy, and data ontology.
Use available, trusted data. Leverage existing, quality data sets that support the decision.
Ensure data quality and governance. Establish processes to validate, refresh, and maintain data so leaders can consistently trust what they see.
Leverage existing software. Use common tools such as Microsoft Power Platform applications that the organization already has available.
Co-create with business analysts. Business analysts are the experts on how the organization will use the data and should help guide development.

What Good Looks Like
When analytics are properly designed and implemented, the signs will be unmistakable. Leaders will leverage and reference dashboards unprompted. Analysts will spend more time interpreting than preparing data, leading to improved mission outcomes for the agency. Leaders make decisions faster, with fewer follow‑up requests and clarifications.
When organizations move too fast, dashboards go unused, multiple versions of the truth emerge, and analysts become system maintainers instead of advisors. If this happens, it is time to pause, reassess, and reconnect dashboards to the decisions they should support.
Data-driven decision-making is not a one-time initiative–it is a journey. When organizations get the basics right, dashboards stop being reports and instead become part of how decisions are made. When you see the PowerPoint slides disappear, and teams and leaders make decisions directly from dashboards, your organization has made a major leap forward.